Situation
The WA Curriculum outlines that students in Year 8 should be able to “acquire, analyse, visualise and evaluate various types of data.” They should also “use structured data to model objects and events that shape the communities they actively engage with. They further develop their understanding of the vital role that data plays in their lives, and how the data and related systems define and are limited by technical, environmental, economic and social constraints.”
On reflection of the Year 8 Digital Technologies program, it was determined that we were not covering this aspect of the curriculum as well as we could.
Action
In order to improve this aspect of curriculum delivery, I sought out some professional development and discovered the Australian Data Science in Education Institute. Linda MacIver, who founded the institute was going to deliver some training in Perth so I registered and attended.
The professional development day introduced the basics of data science and outlined strategies on how to teach it to students as well as why it was an important skill. It also provided some resources and gave teachers an opportunity to collaborate to create more.
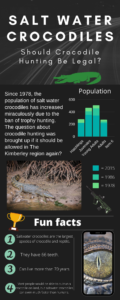
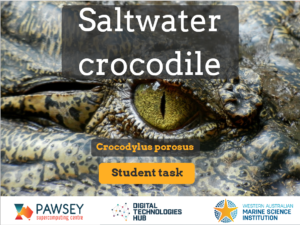
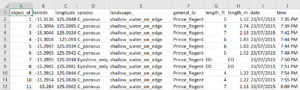
One of the resources provided was about the sustainability of the saltwater crocodile population in the North West of Western Australia. The resource provided raw data on the crocodile population over a period of time and encouraged students to classify the data and prepare visualisations and use this to prepare a response to a proposal before parliament either in support of or against crocodile trophy hunting. The proposal also required that students evaluate the perspectives of different stakeholders on the issue – including the indigenous community in the affected region.
Teaching the program
The way I taught the program was as follows:
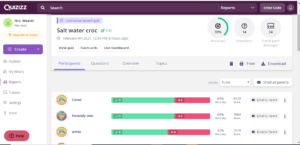
Lesson 1: As a hook into learning for the subject, I had the students undertake a quiz about Saltwater Crocodiles. As well as providing some friendly competition and the chance to win some 1337 tech stickers, the generally poor results across the class help to highlight that we don’t know a lot about Crocodiles.
I then introduce the “Big Question” for students which is “Should we allow crocodile trophy hunting in the North West of WA?”
After discussing what trophy hunting is and why it may be undertaken, I ask students to form a “Value Line” showing their current position on the question we are asking. I then ask various students to justify their position.
Once students return to their seats I ask them what we need to know in order to be able to make a decision which brings us to the topic of data. I then let them know that I have the data all ready for them and quickly walk through how the data has been collected. We talk about the integrity of the data and why that is important.
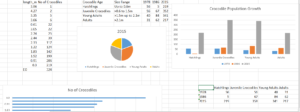
Lesson 2 & 3: I begin this lesson by showing the students the data and asking them to open a copy on their machines from Connect. The first reaction from them should be shock at how they find the data overwhelming. This helps to reinforce the difference between data and information. I then teach them step-by-step how to perform various functions in Excel that will turn what we have from data into information. These functions are things like Sorting, Filtering, calculating things such as the Average (which one is best?) as well as the Minimum and Maximum values. We then create a series of charts that help us to tell the story.
Lesson 4: Students undertake some further research about the nature of crocodiles and begin to ask some questions of the data. They begin to take a stance on the issue at hand and we discuss some of the finer points such as who the various stakeholders are on this issue and how their opinion may be biased in some way.
Lessons 5 & 6: Students have an opportunity to create their presentation in their chosen format.
Outcome
Students were extremely engaged in the activity and developed analytical skills. It encouraged many interesting discussions whilst students were creating their proposals. One student, who has a number of additional diagnoses, found it challenging to create the proposal however, when I sat with him and discussed what things he was seeing in the data, he amazed me with some of his insights. For example, he was one of the only students who identified that the data we had did not allow us to adequately support trophy hunting because not enough time had passed to allow crocodiles to reach sexual maturity.
Students were given a choice in how they presented their proposal – either a video, presentation, poster or any other way that they felt would present their views. As such, students displayed a great deal of creativity and most students submitted work of high quality. The choice also allowed for an embedded level of differentiation in the activity and the exploratory nature allowed many students to extend their thinking by analysing the data at greater depth.